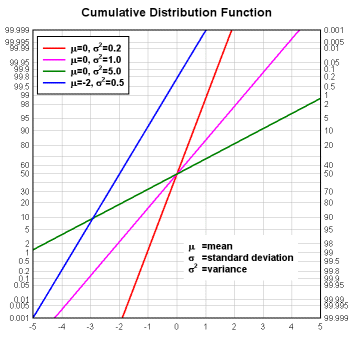
A probability scale is primarily useful in statistical studies. It will show the
cumulative distribution function
of a normally distributed variable
as a straight line.
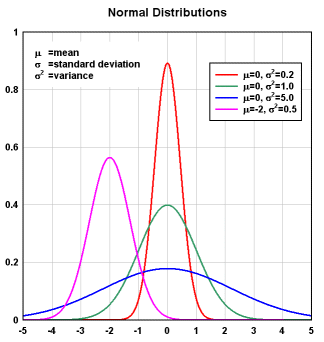
The cumulative distribution function of a standard normal distribution (mean=0, standard deviation=1) is simply the integral of the normal distribution curve. Cumulative distributions for the data graphed above are shown on a linear scale here:
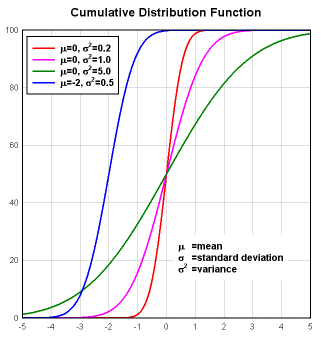
The amplitudes of these curves have been multiplied by 100; DPlot works with probabilities within the range 0-100, exclusive, while other applications may express probabilities in the range 0-1. If you are working with probabilities ranging from 0 (no chance) to 1 (certainty), you can multiply those amplitudes by 100 so that they may be plotted on a probability scale in DPlot. Select Edit>Operate on Y and type "Y*100" for f(Y).
Right-click on the graph and select Linear X - Probability Y to get:
Privacy Policy