GRAPH SOFTWARE FOR SCIENTISTS & ENGINEERS
Features
Try DPlot for yourself
The downloadable trial version of DPlot is a fully functional time-limited demo.
The licensed version of DPlot includes additional modules described at the bottom of this
page. Both versions of DPlot include these features:
- Multiple scaling types, including linear, logarithmic, and
probability scales on the X and/or Y axes.
DPlot also provides several special purpose scale types, including
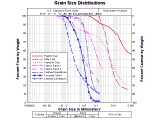
grain size distribution plots,
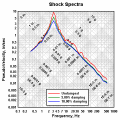
tripartite grids
(shock spectra), polar charts,
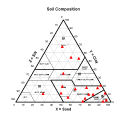
triangle plots, and
N1.85 hydraulic scales. Click
here
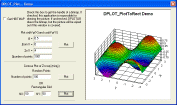
for a rather large screenshot illustrating many of DPlot's plot types.
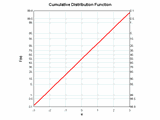
Probability
scaleGrain size
distribution plotTripartite
grid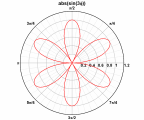
Polar chart Triangle plot N1.85 Hydraulic scale
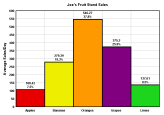
- Bar charts with bars drawn side-by-side or
stacked.
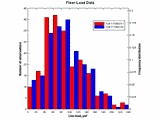
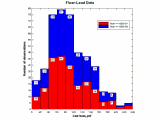
Side-by-side bars Stacked bars
- Box-and-whisker plots and
dot graphs for one or more groups of 1D
data.
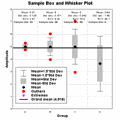
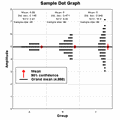
Box-and-whisker
plotDot graph
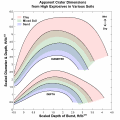
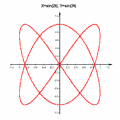
- Multiple independent or
dependent scales.
Independent scales Dependent scales
- Error bars with magnitudes set to a constant value, to a
percentage of the amplitudes, or independently.
Error bars
- Fill between 2 curves, fill the area formed by closing a curve, or fill
from a curve to a specified Y value. Choose from seven pre-defined fill patterns or create a custom pattern.
Fill Patterns
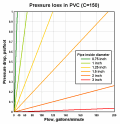
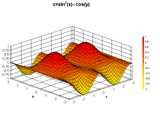
- Contour plots of 3D data, shown as contour lines
in a plan view of the XY plane or as shaded bands in a
3D projection, optionally with
light source shading. DPlot accepts both
randomly-spaced 3D points and points on a rectangular grid. For rectangular grids only, DPlot can also produce a
waterfall plot.
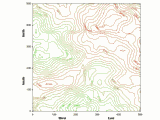
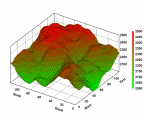
Contour lines 3D projection 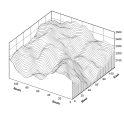
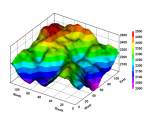
Waterfall plot Phong shading
- 3D scatter plots, with up to 100 data sets and colors based on Z value or data set.
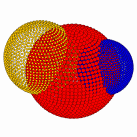

Spheres Airfoil The data for the wing was provided by tools created by SpreadsheetWorld. A nifty animation of the wing was created with Video Edit Magic from a sequence of bitmaps generated by DPlot.
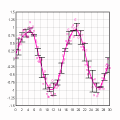
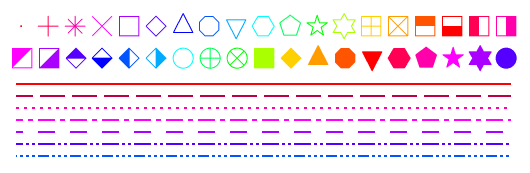
- Choose from 38 symbol styles and/or 7 line styles for your XY plots. You have full control over symbol size,
line weight, and color.
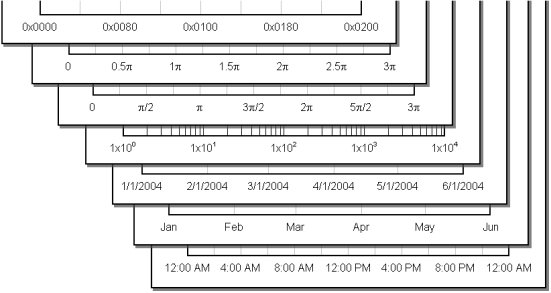
- Choose from a variety of number formats for each axis. Date and time formats are customizable.
- Replace or supplement the numbers appearing along each axis with custom labels.
Custom labels
- Copy and/or link data from other sources (e.g. spreadsheets), or use
our Excel Add-In to easily move data from Excel to
DPlot.
Copy data Excel Add-In
- Copy and/or link DPlot-produced graphics to other applications.
- Add text notations to plots.
- Generate curves from formulas of the form:
Y=f(X) X=f(T) & Y=g(T) Z=f(X,Y)
Along with the standard suite of trigonometric and general math functions, DPlot includes support for conditional formulas of the form if(test,if_true,if_false).
- Least squares curve fitting allows you to
fit a polynomial to your data.
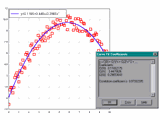
Curve fit
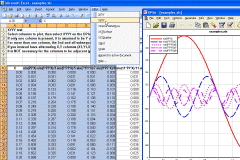
- Data manipulation functions include integration,
differentiation, Fast Fourier Transform,
filtering,
data smoothing, and many other simpler editing functions.
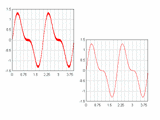
Integration FFT Filtering
- If you have several data records from the same high-speed event and want to play back those records in sync with
each other... well, you can. Have a video associated with your data? Play the video back along with your data,
synchronized at the data rate you specify.
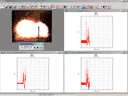
AVI Playback
- Interpolate between points, scan values of
curves graphically, and report peak values.
- Include subscripts, superscripts, and characters
from the Symbol font (Greek characters, trademark symbols, etc.) in the title lines and axis labels of your
plots.
- Plot very large data sets. For XY plots, the total number of data points is limited to about 268 million.
- Create commercial-quality blank graph paper. For examples and instructions see the Graph Paper page.
- Send data to and control DPlot from another program through the free-of-charge
DPLOTLIB interface (a separate download). Example programs with source for
Visual Basic, VB.NET, PowerBasic, 4 different C compilers and 5 different FORTRAN compilers are provided.
DPLOTLIB Demo
- You may create additional functionality with your own plugin modules for file import and data manipulation.
Example C plugin source code is provided with the Plugin Examples.
All image export plugins mentioned below make use of the excellent FreeImage DLL, a toolkit for developers interested in supporting a variety of image formats.
- Bitmap export. Choose from 8- or 24-bit
color depth, and optionally choose run-length encoding for 8-bit files. Though RLE-encoding of bitmaps is not often
used, it is supported by most popular graphics applications and results in a significantly smaller file
for typical DPlot graphs. By way of example, the size of the linked picture is 79Kb with RLE compression,
or 462Kb uncompressed, or 1378Kb if you used copy/paste of the same image with a 24- or 32-bit display.
- JPEG image export. The plugin automatically
selects "good" quality, which is about the minimum acceptable quality that doesn't produce too many
unsightly artifacts. The same picture saved as an RLE bitmap is stored to a 106Kb JPEG file. For a better quality
plot in a smaller file, we highly recommend PNG.
- Portable Network Graphics (PNG) image export.
Unlike JPEG, PNG compression is lossless. And unlike GIF, 24- or 32-bit images can be saved. Compression of DPlot
plots is generally superior to the poorest quality JPEG files and is generally comparable to GIF. By way of
comparison, the BMP example mentioned above is saved to a 21Kb PNG file.
- Graphic Interchange Format (GIF) image export.
This image is saved to a 31Kb GIF file. Like all GIF images, it is limited to 256 colors. For XY plots this is generally
not a limitation, but may result in loss of detail in 3D images with many colors.
- Tagged Image File Format (TIFF) image export. This plugin will always use LZW compression. Files saved with this
plugin will generally be larger than the corresponding PNG image.
Licensed Version Only | Buy Online |
The licensed version of DPlot is distributed with several plugin modules that extend its functionality. Plugin modules include:
- Curve-fitting. This plugin is quite a bit more general than the least squares polynomial curve fits provided
with DPlot. The plugin currently has 9 equation forms you may select from, and unlike DPlot's standard
curve-fitting allows you to fix one or more coefficients in the equation at a constant value. The plugin
currently supports these equation forms:
- y=A+Bx+Cx^2+Dx^3+... (polynomial). Results should be identical to DPlot's curve-fitting algorithm, with the
exception that you may hold coefficients to fixed values.
- log(y)=A+Bx+Cx^2+Dx^3+...
- y=1/(A+Bx+Cx^2+...)
- y=A+B*sin(Cx+D) (sinusoid)
- y=Ax/(B+x)
- y=(Ax+B)/(x+C)
- y=A+B*exp(Cx)
- y=Ax^B + Cx^D + Ex^F + ... (power series)
- y=A + B/[1+10^(Cx+D)] (dose response)
- y=(A+B*sin(Cx+D))*exp(Ex) (decaying sinusoid)
- y=A(x+B)^C
- y=A+Bx+Cx^2+Dx^3+... (polynomial). Results should be identical to DPlot's curve-fitting algorithm, with the
exception that you may hold coefficients to fixed values.
- Bitmap-to-3D conversion. This module reads an image file (.bmp, .gif, .jpg, .png, .tif, .tga and others) and maps
color indices to height values. In the case of bit depths other than 8, the plugin converts the image internally
to 256 gray shades. You control the index-to-height relationship, the X and Y dimensions, and the complexity of
the generated grid. The plugin has serious uses:
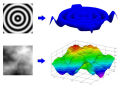
as well as not-so-serious uses:
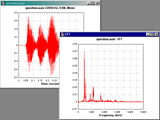
- Wav audio file import and export. Filter and re-save audio files, or alternatively create your own very
annoying chirps and warbles. Hey, I
told you it was annoying! If you're wondering, that .wav file was produced
with y=sin(1000*Pi*x^2) at 11025 samples/sec (dx=9.07E-5). Please note: The input plugin converts
amplitudes to a scale of -1.0 to 1.0, and the export plugin expects the data to be within this range. No errors
will result if the data does not fall within this range, but the amplitudes will be clipped.
- Raw data file import. Read 8-, 16-, or 32-bit signed or unsigned integers, in either Intel (little endian) or
Motorola (big endian) byte ordering. X values will be generated and correspond to the 0-based number of the point.
No scaling is performed; the actual data values are used for the amplitudes (Y values).
- File import for several digital recorders: Tektronix .WFM files,
Gould Instrument Systems .DAT files,
Hi-Techniques Win600 .DAT files,
LeCroy WavePro data files, and
AMO Saturn Transient Recorder data files.
- Baseline shift. This routine differs from the Edit menu command of the same name in that it will
automatically select the time at which the integral of the record should be zero. For explosive events this
generally means finding the arrival time of the shock. This is a big time-saver for those involved in
data processing, particularly if used in a macro with the RunPlugin command. The procedure is described
in detail on the Baseline Shift page.


Privacy Policy