questions
Can I use DPlot to create blank graph paper?
How many data points can I plot?
How do I import my CSV data into DPlot?
How do I import my data files that use a non-supported format into DPlot?
There is no DPlot menu in Excel. How do I make the Excel Add-In work?
How do I make a graph of a circle?
How do I change the direction of coordinate axes?
How do I create a scatter plot?
How do I save a plot to an EPS (Encapsulated PostScript) file?
How do I save a plot to a PDF (Portable Document Format) file?
How do I call DPlot from my Visual Basic program?
How do I import a plot into PowerPoint?
How do I batch print a large number of files?
How do I create a series of plots with the same settings (scaling, labels, colors, etc.)?
How do I force DPlot to create a triangular mesh of my 3D points that is not convex?
How do I create a waterfall plot?
Where can I get free stock market data suitable for plotting in DPlot?
As a program developer, can I distribute DPlot with my application?
I've bought the licensed version. Why is the watermark still shown on DPlot graphs?
Why don't you answer my e-mail?
Who uses DPlot?
What is our privacy policy?
Can I use DPlot to create blank graph paper?
Certainly! Though DPlot will only draw a graph for which there is data (one or more data points), you can easily hide that data by setting the line and symbol styles to "None". Follow these steps to create publication-quality blank graph paper. We'll create a macro to automate this process so that you can quickly recreate the same blank paper at a later date. The example shown here is for log-log graph paper, but you can easily adapt the macro to other scale types or other parameters for this same scaling.
Select the Macro command on the File menu. Enter a name for the macro that you're about to create that you'll remember next week. In the example below we'll be creating log-log graph paper with 3 cycles on the X axis, 4 on the Y, so name the macro "loglog3x4". Now click the "Edit/Create" button.
Select the text below with your mouse, right-click and select Copy. In the Macro Editor, click the Paste button. If you want to assign a shortcut key to the macro, select one of the key combinations in the "Shortcut" list. Now click the "Save" button to save the macro. To now run the macro and create your graph paper, if you used a shortcut key you can simply press that key combination. Otherwise, select the Macro command from the File menu, select your macro from the list, and click "Run"
FileNew()                ' Create a blank XY plot
XYXY(2,1,1,1000,10000)   ' Adds 2 points
Scale(4)                 ' Log X - Log Y
HideCurve(1)             ' Don't draw the "curve"
Size(1,6,8,1)            ' Size of the graph - 6" wide, 8" tall
NumberFormat(0,12)       ' 12="none" for number format
NumberFormat(1,12)       ' This means numbers won't be drawn on the axes
LineWidth(-1,20)         ' Pen for axes is 0.02 inches
LineWidth(0,10)          ' Pen for major grid lines is 0.01 inches
LineWidth(-3,5)          ' Pen for minor grid lines is 0.005 inches
GridLines(1)             ' Box around plot w/ grid lines
DenseGridLines(1)        ' Looks crowded on the display, but nice when printed
Color(0,128,128,128)     ' Set grid color to a med. gray
Click here for a PDF file of this graph paper.
For help on any macro commands, simply move the text insertion point to the appropriate line and click the Help button in the macro editor. Each of the commands shown above is explained in detail in the Help file.
For additional graph paper examples, including free PDF downloads of those examples, see the Graph Paper page.
How many data points can I plot?
There is effectively no limit. We frequently work with plots containing several curves and 2 million
or more points per curve. The only actual limit for the number of points per curve is the maximum magnitude
of a signed 32-bit integer divided by 8 bytes per value: (2^31-1)/8 = 268,435,455. You will probably find that the
practical limit is determined by how much physical RAM your system has.
How do I import my CSV (comma-separated values) data into DPlot?
If your files are XY data with X values in the first column and all subsequent columns being Y values for
separate curves, you can drag-and-drop your CSV files onto DPlot and it will correctly interpret them,
including (if present) titles and axis labels (for a single curve) or legend entries for multiple curves.
CSV files may also be opened with the File>Open menu command, of course (select the Multiple columns file type).
DPlot includes support for 3D (X,Y,Z) data and for XY data also allows you to specify which columns to plot,
which column is X, or to specify that the data is alternating X,Y columns rather than X,Y,Y,Y. "CSV"
is actually a bit misleading in this case, as DPlot will also allow tab- or space-separated columns. DPlot
will also allow you to save your data to a CSV file that can be read directly by Microsoft Excel.
How do I import my data files that use a non-supported format into DPlot?
With a file import plugin. You can add plugin modules (DLL's) to import data into DPlot (export, too). Example C source code for a file import plugin is provided in the plugins download. This is a separate download not included with the main distribution. Alternatively, if you're unaccustomed to writing DLL's we'd be happy to produce a plugin for licensed users at no charge, provided that you can furnish the file format details. Contact us for more information.In many cases DPlot may not have direct support for a specific format, but you may be able to easily convert
that format to a form that DPlot does handle. For example, Hobo data loggers from
Onset Computer Corporation
produce a proprietary format for which Onset provides no documentation. But the software products BoxCar and LogUtil
from Onset can be used to save the file in a format that DPlot will read correctly. The LogUtil program is free and
can be downloaded from the
Onset Software Upgrades and Utilities
page. Using LogUtil, export your Hobo data logger file to its "Custom" format with
"Month/Day/Year Hours:Minutes:Seconds". The resulting file may be opened in DPlot by drag-and-dropping
it onto the DPlot window or with the File Open menu command as a "Multiple columns" file.
There is no DPlot menu in Excel. How do I make the Excel Add-In work?
If you did not elect to install the optional Add-In when you ran the DPlot setup program, you will need to re-run the setup program and make sure to check the "MS Excel Add-In" box on the "Select Components" screen. If you did elect to install the Add-In, the problem is most likely that the security settings in Excel prevented the Add-In installation from being completed. In that case open Excel. On the Tools menu select Add-Ins: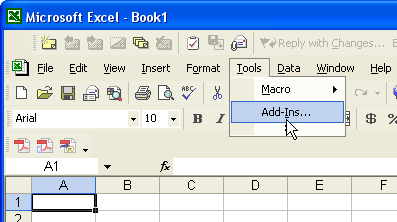
There should be a "DPlot Interface" box:
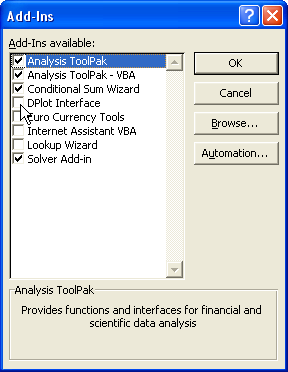
Check that box, then click OK.
How do I make a graph of a circle?
The Y=f(X) command will only generate data points for which there is one unique Y value for every X. So even though Y=sqrt(R^2-X^2) is the correct equation for a circle, use of this equation with Y=f(X) will only result in a semicircle (the positive Y half). But don't despair; generating a circle is no problem with X=f(T), Y=g(T). With T varying from 0 to 360 degrees, X=R*cos(T), Y=R*sin(T) defines a circle of radius R (substitute the actual radius for "R") centered at the origin. Of course if you want a circle centered at (H,K), you'd use X=H+R*cos(T) and Y=K+R*sin(T).
Initially the physical dimensions of your circle will most likely not be circular, depending on the window size. That's simply because by default, DPlot uses as much of the display monitor as possible to plot your data. You can force circular circles by using the Extents/Tick Marks/Size command and specifying equal extents for the X and Y axes and equal physical dimensions (check Specify plot size and enter equal values for the plot width and height).
The X=f(T), Y=g(T) command is of course useful for other geometric shapes that have more than one
Y value for each X. To plot an ellipse X^2/A^2 + Y^2/B^2 = 1, for example, use X=A*cos(T),
Y=B*sin(T) with, again, T varying from 0 to 360 degrees.
How do I change the direction of coordinate axes?
Normally, values on a linear or logarithmic scale increase from left to right (or bottom to top). You can change the direction by selecting the Extents/Tick Marks/Size command on the Options menu and checking the appropriate "Invert" checkbox below "Specify Extents". For example, if your logarithmic scale on the X axis normally extends from 1 on the left to 1000 on the right, check "Invert X" to change the extents to 1000 on the left, 1 on the right.
For 3D data you can achieve similar results by specifying negative scale factors for the appropriate axes with the
Contour Options (for surface plots) or Scatter Plot Options (for 3D scatter plots) commands under the
Options menu.
How do I create a scatter plot?
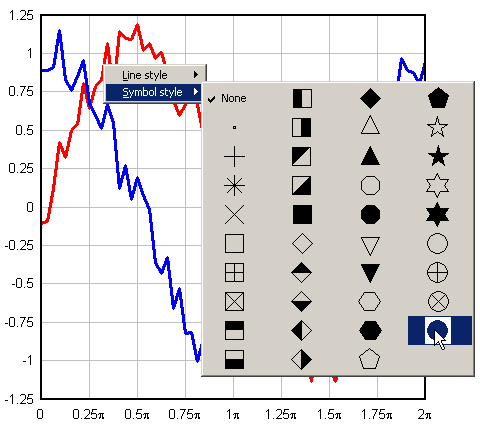
In this context, by "scatter plot" we mean a plot with symbols at each data point, and no line segments connecting the data points. Right-click on a curve, select Symbol style, then click on the symbol style you want:
Right-click again on the curve, select Line style, then select "None".
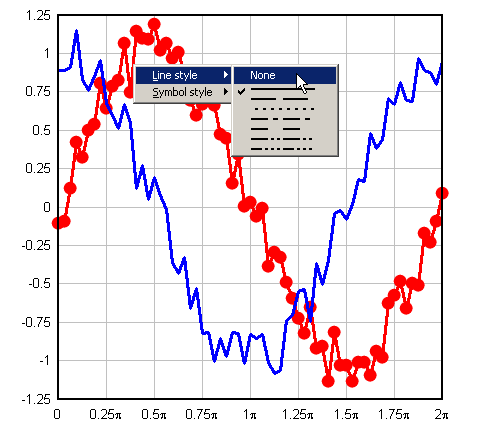
Repeat for each curve. If you have more than one or two curves, you might prefer to select the Symbol/Line Styles command on the Options menu. For all curves, choose "0 - none" for the line type, and select the symbol type you want to use for each curve. The Symbol/Line Styles dialog is also used to set the size and frequency of symbols.
How do I save a plot to an EPS (Encapsulated PostScript) file?
DPlot has no direct support for EPS output. But Windows does, and it's fairly simple to make DPlot produce EPS files. If you do not already have a PostScript printer installed:
- Start Control Panel.
- Select Printers, then Add a Printer.
- Click Next to cycle through the first couple of dialogs. You're now going to install a PostScript printer. It doesn't matter if you actually have a particular printer or not since you won't be printing to it. If you know you'll only want to save B&W output, any of the HP LaserJet PostScript printers are good choices. If you want color information saved to the file, of course select a color printer, e.g. the HP Color LaserJet 5/5M. Of course if you know what the final output destination for your EPS files is and that printer driver is available, then you should install that printer.
- After selecting a printer click Next. Under Available ports select FILE:. This is not critical since the Print dialog in DPlot will give you the option of printing to a file, but it might save you a few headaches of attempting to print to a nonexistant printer later on.
- Click Next to cycle through the remaining dialogs, and... you're done.
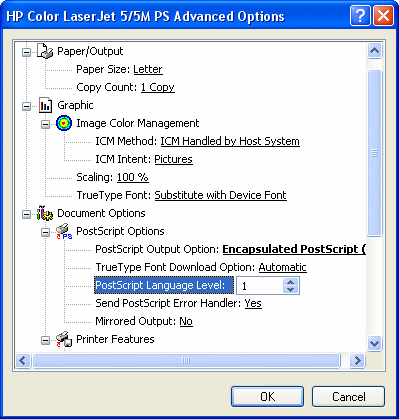
After selecting the Print command in DPlot, be sure to select the PostScript printer from the list of available printers. Click Properties, then... well then what you do will be largely dependent on what version of Windows you're running and which printer driver you're using. For the HP LaserJet family of printers on Windows XP:
- Click the "Advanced" button.
- Under Document Options>PostScript Options set PostScript Output Option to "Encapsulated PostScript (EPS)".
- To ensure compatibility with the widest variety of applications, set PostScript Language Level to 1, rather than the default 2. (Microsoft Word, for example, will open but will not display an EPS file using level 2, but displays level 1 files just fine.)
- Click OK twice to return to the main Print dialog.
Back on the main Print dialog, be sure to check Print to file. You'll be presented with a Print to File
dialog that will allow you to specify the name of the output file. Don't worry if the default filename extension is
".prn"; just type the filename with an extension of ".eps".
How do I save a plot to a PDF (Portable Document Format) file?
As with EPS files, DPlot does not directly support output of the PDF format and the solution is very similar to the EPS problem. However, Windows isn't much help here and you'll need Adobe® Acrobat or any other Adobe product that includes Acrobat Distiller or the Adobe PDF virtual printer driver. If you have Acrobat installed you should see Acrobat Distiller and/or Adobe PDF as one of the possible choices of printer in DPlot's Print dialog. Select it. You may also have an option of Acrobat PDFWriter. However, PDFWriter has problems with DPlot contour plots, while Distiller and Adobe PDF handle these plots perfectly.
Note: The Adobe printer drivers offer several methods for compressing bitmap images, with JPEG compression being the default. The JPEG method does compress the image very effectively, but the result is generally poor with DPlot-produced graphics. ZIP compression produces larger files but much better quality images.
If you do not have access to one of those Adobe® products, there are several low-cost PDF virtual printer drivers available on the internet. The following vendors provide free trial versions of low-cost PDF printer drivers that have all been tested successfully with DPlot:
- Pdf995 from Software995.
- docuPrinter LT from Neevia Technology.
- PDFcamp from veryPDF.
How do I call DPlot from my Visual Basic program?
By far the easiest way is to link your program with DPLOTLIB.DLL. This developer's tool is included with the DPlot Jr distribution and also as a separate download. DPLOTLIB works with either the full version of DPlot or DPlot Jr (it will always choose the full version if both are installed). Example programs with full Visual Basic (C and FORTRAN, too) source code are included. Documentation is included with the distribution and is also available online.
In almost all cases DPLOTLIB will be sufficient for your needs. In some instances you may want more direct control
over DPlot through DDE (dynamic data exchange) calls. We have you covered here as well. Source code examples in Visual Basic,
Excel VBA, and C are included in the DDE examples.
How do I import a plot into PowerPoint?
Or, for that matter, any of the Microsoft Office products? Very easily. Use the Copy command (or
corresponding toolbar button or shortcut key) to copy your plot to the clipboard, then paste into the target program. For
XY plots DPlot creates both metafile and bitmap representations of your plot; 3D plots are copied as bitmaps only. In general,
metafiles are more flexible than bitmaps since they are scaleable. If you want a bitmap rather than a metafile, use
the target application's Paste Special command rather than Paste, and select Device independent bitmap.
DPlot also allows you to specify the size of the metafile and/or bitmap prior to copying to the clipboard, so you can make
the plot exactly the size you want within DPlot without worrying about scaling the picture in the other application.
How do I batch print a large number of files?
With a DPlot macro (created within DPlot). The following macro will print all of the CSV files in the folder C:\MYDATA.
Directory("C:\MYDATA")
FileType(4)
ForFilesIn("*.CSV")
FilePrint()
FileClose()
NextFile
Macros are of course good for other batch operations as well. The following macro reads all CSV files in the folder C:\MYDATA and saves Windows metafiles with default dimensions of 6x4 inches and with the same filename and a ".wmf" extension.
Directory("C:\MYDATA")
FileType(4)
SetMetafileDims(6,4)
ForFilesIn("*.CSV")
FileSaveAs(4096,"")
FileClose()
NextFile
How do I create a series of plots with the same settings (scaling, labels, colors, etc.)?
There are a number of ways to accomplish this. Which method is best for you will depend on the frequency with which you use these same settings.
- Create the first plot with all of the formatting that you want to use in subsequent plots. Select Save
Preferences on the File menu. After creating any subsequent plots, whether by DDE, reading a file, pasting
from the Clipboard, or entering values using Edit Data, use Get Preferences on the File menu
to restore the previously saved preferences. This includes titles and axis labels (existing labels will not be
replaced), colors, line styles, scaling, etc.
You can easily help automate this last step by creating a macro to open this preferences file and assigning a hotkey to the macro. For example, this macro:
GetPreferences("c:\program files\dplot\myprefs.set")
ViewRedraw()
will read the file myprefs.set and redraw the plot using the settings found in that file.
- Same as above, but save your preferences to DEFAULT.SET in the default folder
(\Documents and Settings\<username>\Application Data\DPlot on Windows 2000 and XP, or the folder where
dplot.exe is located on Windows 95 and 98). DEFAULT.SET will be processed every time a new plot is created,
without reading settings using the Get Preferences command.
- If you want to restore some, but not all, of the settings saved to a preferences file, e.g. colors only, you can fairly easily create a macro to reproduce all the settings you're interested in. A full description of creating macros and all available macro commands is in DPlot's Help file.
How do I force DPlot to create a triangular mesh of my 3D points that is not convex?
The short answer is... you can't, at least not initially. DPlot is only reading X,Y,Z values from your input source, whether that source is a file, the Windows Clipboard, communication from another program, or the Edit Data command. This is not enough information to determine where the edges of the surface should be, or for that matter to determine whether your surface should have any interior holes. DPlot always creates a convex triangular mesh from X,Y,Z input, which for many applications is exactly what you want. It is of course possible that you will not want a convex mesh. In this case DPlot will have created triangles outside the desired limits of your plot. The solution is to use the Define Boundary menu command to describe the exterior boundary of your surface. See the description of the Define Boundary command for more information.
How do I create a waterfall plot?
Waterfall plots can be created directly from
3D points on a rectangular grid - for example points generated with the Z=f(X,Y) command or sent to DPlot
from another application through the DPLOTLIB interface. But in most cases you'll
start with random 3D points, for example X,Y,Z columns pasted from the clipboard, and the waterfall plot option will
be disabled. To reorganize these points on a rectangular grid, use the Generate Mesh command on the Options
menu. This command gives you several options controlling the complexity of the grid and the smoothness of the generated
mesh. After running Generate Mesh you'll find that the waterfall plot option is now enabled for 3D plots.
Where can I get free stock market data suitable for plotting in DPlot?
This isn't strictly a DPlot question, of course, but if you are interested in the stock market you will probably find this handy.
- In your internet browser go to http://finance.yahoo.com.
- Enter stock symbol in "Quotes and Info" search box, then click GO (or look up symbol in appropriate search window).
- When stock data page displays, click on Historical Prices in the left column.
- When Prices matrix is displayed (with 1st of several pages for 5 years or more of data), scroll to the bottom of the page and click on Download To Spreadsheet.
- You have a couple of options at this point, dependent on whether you have Microsoft Excel installed or not. If you choose Open, the spreadsheet will be opened in the default application for CSV files (normally Excel). If you choose Save then you can later open this file in either Excel or in DPlot (by drag-and-drop, Explorer's right-click "Open With...", or within DPlot with File>Open and file type D.
- If you choose to open the data in Excel, as a minimum select the first column (Date) plus whatever columns you are interested in, then select XYYY on the DPlot menu. Don't have a DPlot menu in Excel? Install the Add-In.
- Whether opening the file directly in DPlot or using the Excel Add-In, if you plot Volume along with Open, Close, etc., you will probably find that the volume extents are much larger than the price extents. In that case select Options>Multiple Axes, select Independent Y2, under Curve select "Volume", then select Y2. Alternatively, of course, you can opt not to plot Volume on the same graph. Example
;)
As a program developer, can I distribute DPlot with my application?
In short, no. But don't go away yet, there is a solution. If you haven't already checked out DPlot Jr you'll want to take a look. The price is right: it is free. Any plot that your program can produce with DPlot can also be produced with DPlot Jr. If the limitations of DPlot Jr are unsatisfactory to you, contact us for more information on a bulk license for DPlot.
I've bought the licensed version. Why is the watermark still shown on DPlot graphs?
If you followed the download and installation instructions you received after your purchase, then there are two possible explanations for why the watermark is still shown:
- You previously installed the trial version, and installed the licensed version to a different location. The default location for both programs is c:\Program Files\DPlot. If you think this is a possibility then the surest way to correct the problem is to uninstall all copies of DPlot using Control Panel's Add/Remove Programs applet, then reinstall the licensed version.
- You correctly installed the licensed version but have never run it as a standalone program, instead launching via the Excel Add-In or another program. In this case all you need to do is start DPlot using the desktop icon or the Windows Start menu. You'll be prompted for your username and registration number, which were provided when you purchased DPlot. The watermark will then no longer be shown.
Why don't you answer my e-mail?
All e-mail inquiries are answered as soon as possible, generally within an hour if sent during normal business hours
through late night US Central Time. If you are not receiving answers to DPlot support questions it is almost certainly due to the
reply mail being blocked by your mail server, whether it is erroneously flagged as spam, or being held on the server because
support@dplot.com is not on your "whitelist". This situation is not likely to improve as long as the world is
plagued with spam. Best suggestion: use the DPlot Forums to post
your question. If you do not want to post your question publicly you can post a private message after registering on the Forums.
Privacy Policy